Star Alliance Airline Soars with Alteryx Server
At a Glance
1000+
Workflows Governed
10
Departments Migrated
25
Alteryx Champions Trained
Overview
Service
Data Engineering & Infrastructure
Industry
Airlines
Stack

Dashboard & Automation
From Queue to Clarity: Real-Time Ticketing Analytics in Power BI
Author(s)

William Chan
Co-Founder & CEO
Technology Stack


The Challenge
A leading sports ticketing company relied on fragmented reports and manual processes to track ticket sales and sell-through rates for their clients — teams and venue operators. This disjointed approach led to inconsistent insights, delayed decision-making, and difficulties in identifying unsold inventory in time for strategic adjustments. Without a reliable, professional, centralized, real-time view of ticketing performance, they struggled to optimize pricing, maximize attendance, and proactively manage sales trends.
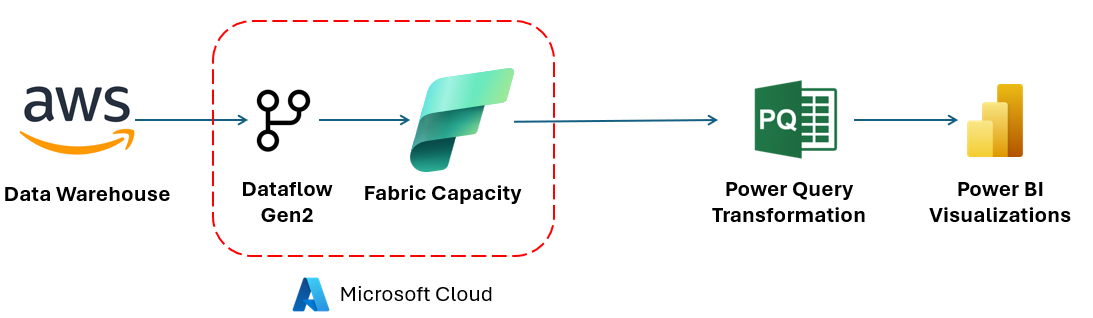
The Solution
Leveraging Power BI and Microsoft Fabric, we developed an integrated reporting solution that standardized and streamlined ticketing data across multiple sources. Using Fabric's data transformation capabilities, we automated the process of joining and cleaning sales data, eliminating the inefficiencies of manual reporting. This enabled the creation of a centralized Power BI dashboard that provided real-time visibility into key metrics, including sell-through rates, get-in pricing, in-stadium sales trends, and potential market gaps. By automating data integration and visualization, the solution empowered teams to shift from reactive decision-making to a more strategic, data-driven approach to ticketing performance and revenue optimization.
Impact
~700
700 Hours Saved / Year in Manual Reporting
4
Data Sources Unified (primary ticketing, secondary marketplace, POS & CRM)
1
Dashboard For Real-Time Sell-Through Visibility
Stack
Our Client's Context
The sports ticketing industry is fast-paced and highly competitive, where success depends on both maximizing revenue and delivering an exceptional fan experience. While teams and venue operators leverage data to optimize pricing and sales strategies, many still rely on fragmented reporting and manual data reconciliation. This creates challenges in tracking key performance metrics, identifying market trends, and making timely adjustments to improve sell-through rates.
Our client struggled to consolidate ticketing data across multiple platforms, making it hard to analyze sales trends, get-in pricing, and stadium-specific performance. Without a centralized and real-time reporting solution, teams struggled to communicate their value and high sell-through rate. By streamlining data integration and visualization, they aimed to transition from reactive sales tracking to a proactive, data-driven approach that enhances both profitability and fan engagement.
A Fragmented Playbook: Challenges Behind the Scenes
Currency Handling
Handling multiple currencies is a challenge for any team, especially when teams want to see their revenue and data in local currency. Without automated conversion, analysts were forced to manually reconcile figures across markets — adding delay and risk of error to an already fragmented reporting process.
Disparate Data Sources
A mix of platforms — including primary ticketing systems, secondary marketplaces, point-of-sale systems, and CRM tools — created a fragmented data environment. The lack of standardized fields, inconsistent timestamps, and varying data refresh rates made it difficult to align and reconcile sales, inventory, and customer data, resulting in delays, errors, and significant manual effort to build any coherent view of performance.
Lack of a Unified Performance View
Without a centralized reporting structure, leadership lacked a clear global-to-micro view of ticket sales performance. Decisions on pricing, inventory management, and sales strategy were made without a reliable foundation, limiting both operational efficiency and the ability to demonstrate value to the teams they served.
Passing the Ball Upcourt
Data Integration & Standardization
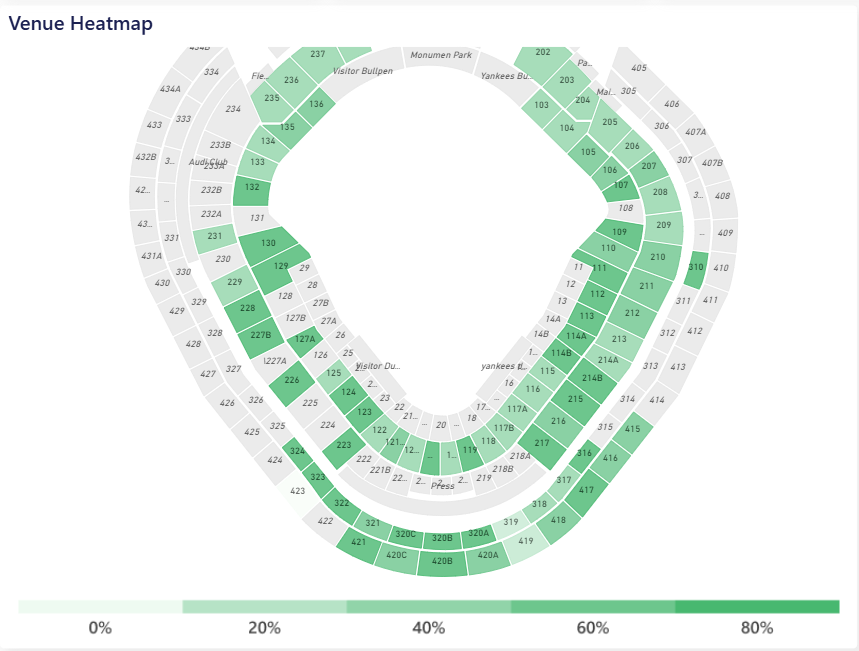
The client's main challenge was bringing the relevant data together and communicating it through a unified ticket performance dashboard. Compass helped identify the critical joins between internal systems and external data sources to build a complete picture of each venue's ticket performance. To enhance visualization, the team developed a method to embed stadium heatmaps directly into Power BI, enabling interactive, spatially aware reporting that was previously out of reach.
Visualization & Performance Analytics
Previously the client could not consolidate all data sources and had difficulty accessing historical data and insights. Compass built professional, interactive Power BI dashboards with flexible filtering, drill-down capabilities, and automated reporting. Users can now track and analyze sales trends, get-in pricing, and stadium-specific performance in real time, with enhanced visibility into resale activity. Reports are structured to support both the client's internal teams and the sports organizations they serve, ensuring data-driven decision-making at every level.
From Queue to Clarity: The Business Impact
Compass delivered a centralized, automated ticketing analytics platform that transformed how Optimal Ticketing and their sports clients operate. The solution replaces fragmented manual reporting with a single, real-time view of performance — enabling smarter decisions at every level of the organization.
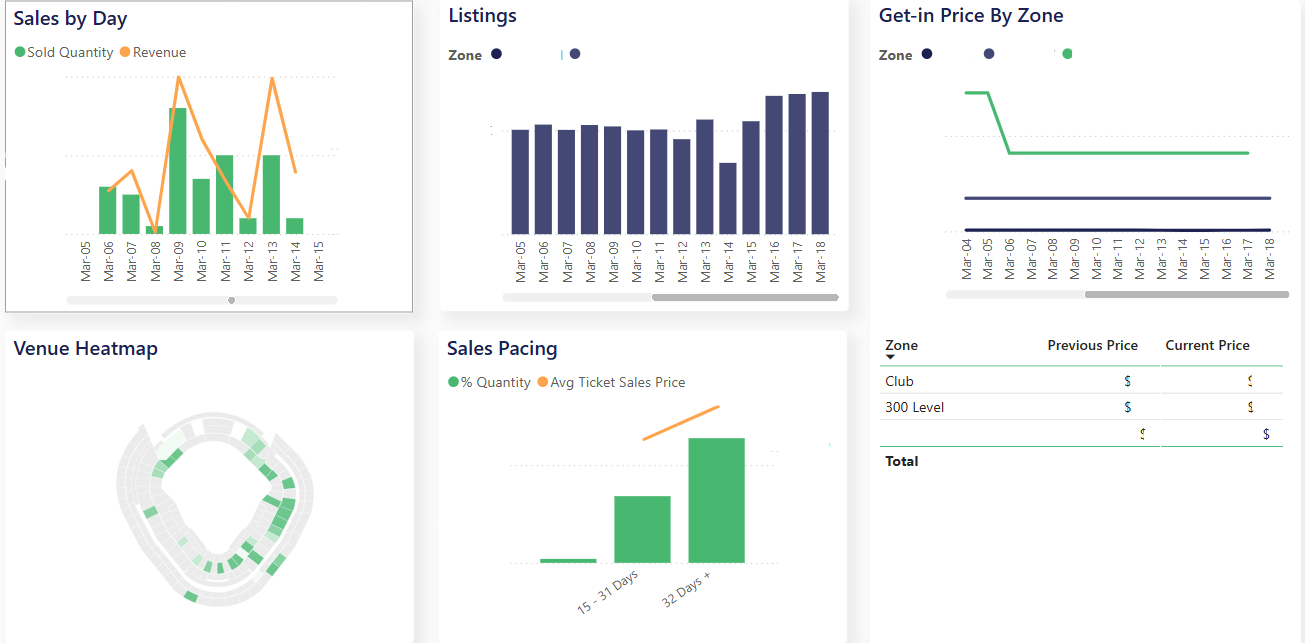
Unified Real-Time Ticketing Dashboard
The Power BI dashboard centralizes ticketing data from multiple platforms into a single, authoritative view covering sell-through rates, get-in pricing, in-stadium sales trends, and potential market gaps. Teams and venue operators can access performance metrics on demand, with flexible filtering and drill-down capabilities that replace the fragmented, manually reconciled reports they previously relied on.
Benefit: Leadership now has a clear, consistent view of ticket sales performance across all venues and markets, enabling faster and more confident strategic decisions that directly support revenue optimization and attendance goals.
Automated Data Integration Across Platforms
By automating the ingestion, joining, and cleaning of data across primary ticketing systems, secondary marketplaces, point-of-sale systems, and CRM tools, Compass eliminated the manual reconciliation work that previously consumed significant analyst time. Currency handling was standardized within the same pipeline, allowing teams to view revenue and performance data in local currency without additional manipulation.
Benefit: Account managers save approximately 700 hours per year previously spent on manual reporting — freeing them to focus on strategy, client relationships, and revenue optimization rather than data wrangling.
Interactive Stadium Heatmaps and Historical Analytics
Stadium heatmaps integrated directly into Power BI give teams and venue operators a spatial view of ticket sales and unsold inventory, enabling targeted interventions before it is too late to act. Combined with historical trend analysis and real-time resale visibility, the dashboards support proactive pricing adjustments and sales strategy across the full event cycle.
Benefit: Teams can now identify unsold inventory and pricing opportunities in real time, shifting from reactive adjustments to a proactive, data-driven approach that consistently improves both attendance and revenue outcomes.